Capture and Analyze Packets with Wireshark — Learning Networking with Code, Day 10
📅
Before We Begin 🔗
Last time, we learned how firewalls and NAT protect networks. Today we'll capture the pieces of data that travel across a network, known as
packets
, and inspect what they contain. We'll use Wireshark
to see how the OSI layers, TCP/IP, HTTP, and other concepts we've covered appear in real network traffic.What Is Packet Capture? 🔗
Packet capture records the packets passing through a network interface, such as an Ethernet or Wi-Fi adapter, so you can inspect and analyze them. It's like opening letters in transit to see what they contain, in this case for authorized, educational purposes.
Developers and network administrators use packet capture for several tasks.
- TroubleshootingFind out why an internet connection is slow or why a particular service is unreachable.
- Learning how protocols workObserve the TCP handshake or the structure of HTTP requests and responses in real traffic.
- Security analysisDetect and investigate suspicious traffic or malware activity.
- Performance analysisMeasure network latency and traffic volume to evaluate performance and find areas for improvement.
Wireshark 🔗
Wireshark is a widely used open-source network protocol analyzer. It's free and offers powerful features for everyone from students to professionals.
Install Wireshark 🔗
Wireshark supports Windows, macOS, and Linux.
- Visit the official websiteOpen www.wireshark.org↗.
- Download WiresharkChoose the latest stable release for your operating system.
- Install WiresharkRun the installer and follow the prompts.
- WindowsThe installer offers to install the Npcap packet capture library (or WinPcap in older versions). Keep this option selected so Wireshark can capture packets. It is usually selected by default.
- macOSYou may see a permissions prompt when launching Wireshark for the first time. Follow the instructions to grant the required permissions. Install ChmodBPF for packet capture access. You can start the installation from Wireshark.
Wireshark Basics 🔗
Wireshark may look complicated at first, but the basic workflow is straightforward. We'll walk through a full exercise shortly. First, here's how the interface works.
- Select a network interface
- Wireshark lists your computer's network interfaces, such as Ethernet and Wi-Fi.
- Pick the interface that is connected to the internet and carrying traffic. If you're unsure, look for activity in the small graph next to each interface name.
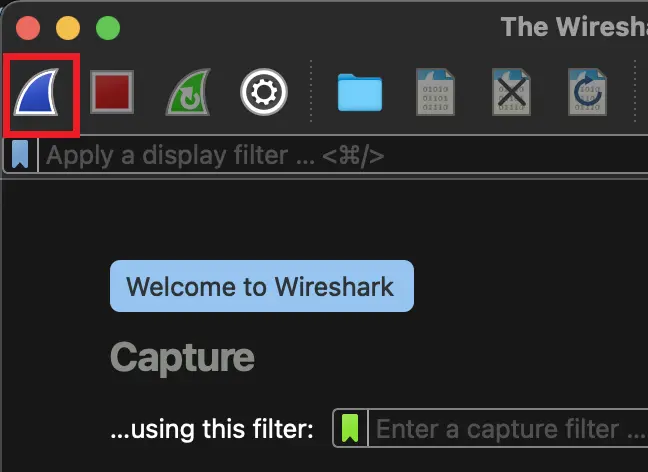
- Double-click the interface or select it and click the blue shark fin icon labeled Start capturing packets.
- Start and stop capture
- Packets appear in real time after the capture starts.
- Once you have enough data, click the red square labeled Stop capturing packets.
- Explore the Wireshark windowThe capture view is usually split into three panes.
- Packet List PaneEach row summarizes a packet in chronological order. It shows the packet number, time, source and destination IP addresses, protocol, length, and a brief description.
- Packet Details PaneSelect a packet to see its protocol layers, such as the Ethernet, IP, and TCP headers and the HTTP data, in a tree. Expand each layer to inspect individual fields.
- Packet Bytes PaneThis shows the selected packet's actual bytes in hexadecimal and ASCII. Selecting a field in the details pane highlights the corresponding bytes.
- Use filters
- If the capture contains too many packets, a display filterlets you show only those that match a condition.
- Enter the condition in the filter bar at the top and press Enter.
- Common filters
ip.addr == 192.168.0.1displays packets with192.168.0.1as the source or destination IP address.tcp.port == 80displays packets with source or destination TCP port 80, commonly used for HTTP.tcp.port == 443displays packets with source or destination TCP port 443, commonly used for HTTPS.httpdisplays HTTP packets.dnsdisplays DNS packets.!(arp)excludes ARP packets. The exclamation mark means “not.”tcp.flags.syn == 1 && tcp.flags.ack == 1displays SYN-ACK packets, part of the TCP three-way handshake.
- If the capture contains too many packets, a
Exercise: Analyze an HTTP Request 🔗
Let's use Wireshark to see which packets are exchanged when you visit a website.
- PrepareOpen Wireshark and choose a network interface.
- If there are several interfaces, choose the one currently connected to the internet.
HTTPS is encrypted, which makes the contents difficult to inspect. This exercise uses plain HTTP. If you don't have a test site, look for an older site that still supports HTTP or run a simple local web server. Public HTTP sites are becoming less common.- If you can't find a suitable site, try
http://example.com, which is reserved for examples, orhttp://info.cern.ch, the first website.
- Start the captureSelect the network interface and start capturing. Click the blue shark fin icon or select
Capture > Start. - Open the HTTP site in your browserVisit the address you chose and wait for the page to finish loading.
- Stop the captureReturn to Wireshark and click the red square or select
Capture > Stop. - Filter for HTTP packetsType
httpinto the filter bar and press Enter to display only HTTP packets. - Analyze the packets
- Find the HTTP GET requestIn the packet list, select the
GET / HTTP/1.1request or a similar message from your client IP address to the web server's IP address. - Inspect the requestExpand Hypertext Transfer Protocol in the details pane and examine the request line and headers, such as
HostandUser-Agent. - Find the HTTP responseSelect the
HTTP/1.1 200 OKresponse, or a similar message, from the server to the client. - Inspect the responseLook at the status line, headers, and response body if present. The HTML may appear as Line-based text data.
- Optional: inspect the TCP handshakeClear the HTTP filter and look for the SYN, SYN-ACK, and ACK packets just before the request. Try
tcp.port == 80 && (tcp.flags.syn == 1 || tcp.flags.ack == 1).
The exercise shows how a browser communicates with a web server at the packet level and gives you a closer look at the structure of HTTP.
Wireshark Tips 🔗
- Save and reopen capturesSave captured packets with
File > Save Asand reopen them later withFile > Open. - Explore statisticsThe
Statisticsmenu offers views such as protocol hierarchy, conversations, and endpoints. Use them to understand the overall traffic. - Apply coloring rulesWireshark colors rows by protocol or other conditions so you can pick out important packets. Find these settings under
View > Coloring Rules. - Use the right-click menuRight-click a packet or a field to see analysis options such as Follow > TCP Stream, which reconstructs the data flow for a TCP connection.
Conclusion 🔗
We learned the basics of Wireshark and captured and analyzed a real HTTP exchange. Seeing what happens inside a network connection helps you diagnose problems and understand how protocols work.
Wireshark can look complex at first. Practice with different display filters and captures to deepen your understanding of networks.
Next time, we'll look at ways to improve network performance and address bottlenecks.