You receive feedback that a page that is fast for users in Seoul is slow for users in the United States.
The server response time logs show the same 50 ms for both, yet the time users actually experience differs several-fold.
That difference arises outside the server, in
the delay that accumulates as packets cross the network
.
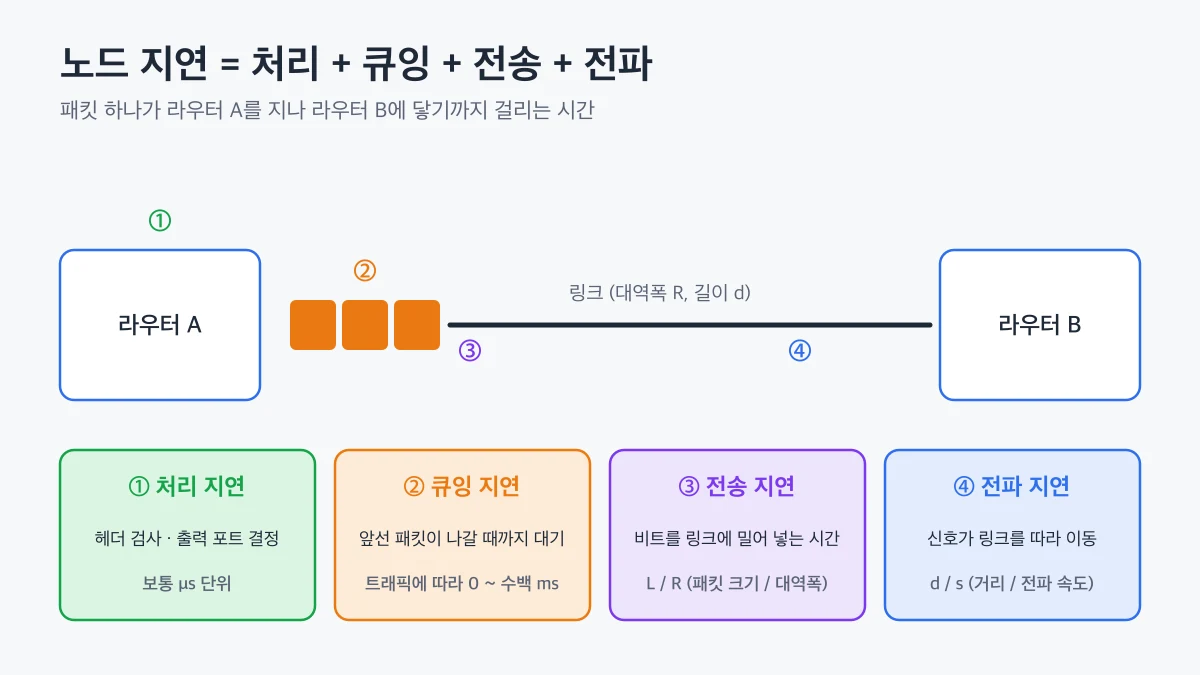
In this article, we distinguish the
four types of delay
a packet experiences when passing through a single router and explain how to calculate each one.
We then look at the conditions that cause
packet loss
and the bottleneck link that determines end-to-end
throughput
, and finally measure real values with macOS commands.
If the output link is transmitting another packet, the new packet waits in the queue.
This waiting time is the
queuing delay
.
Because queuing delay depends on
the number of packets already waiting ahead
, it varies the most of the four delays.
It is close to zero when there is no traffic, but under congestion it can grow to tens or hundreds of milliseconds.
is the time it takes to push all of a packet's bits onto the link.
If the packet size is L bits and the link transmission rate is R bps, the transmission delay is L/R.
Transmission delay is
independent of the link's length
and depends only on the packet size and link speed.
is the time it takes for a bit that has been pushed onto the link to travel to the router at the other end.
If the link length is d and the signal speed in the medium is s, the propagation delay is d/s.
In optical fiber or copper wire, the signal speed is roughly 2 × 10⁸ m/s, a little slower than the speed of light.
Because their names are similar, these two delays are often confused.
Using a highway toll booth analogy, the time for ten cars to pass through the toll booth is the transmission delay, and the time for the last car to drive to the next toll booth is the propagation delay.
The table below calculates both delays for a 1,500-byte packet.
Segment
Conditions
Transmission delay L/R
Propagation delay d/s
Office LAN
100 Mbps, 100 m
0.12 ms
0.0005 ms
Seoul–Los Angeles submarine segment
100 Mbps, about 9,600 km
0.12 ms
about 48 ms
At the same transmission rate the transmission delay is identical, but as distance increases, propagation delay becomes overwhelmingly larger.
The biggest reason intercontinental services are slow is physical distance rather than bandwidth
, which is why placing servers close to users with CDNs and regional deployment is effective.
You can estimate how large queuing delay will become using
traffic intensity
.
If packets arrive at an average rate of a per second, the packet size is L bits, and the link transmission rate is R bps, the traffic intensity is La/R.
When La/R is close to 0
Few packets arrive, so queuing delay is small.
When La/R approaches 1
Packets that arrive in short bursts start to build up in the queue, and the average queuing delay increases sharply.
When La/R is greater than 1
Packets arrive faster than they can be transmitted, so the queue grows without bound and packets are eventually dropped.
🖐️
Systems must be designed so that traffic intensity does not exceed 1.
If you run a link or server at close to 100% utilization, average throughput may look high, but
Because a router's queue capacity is finite, packets that arrive when the queue is full are dropped.
Lost packets are retransmitted by upper-layer protocols such as TCP, or, in services that do not retransmit, such as real-time calls, they show up directly as reduced quality.
Network performance is therefore evaluated not only by delay but also by
loss rate
.
When losses repeat, TCP interprets them as congestion and reduces its sending rate, so loss ultimately leads to lower throughput.
If there are N−1 routers between the source and destination and the network is not congested, the end-to-end delay ignoring queuing is N × (processing delay + transmission delay + propagation delay).
In real measurements, the queuing delay at each router is added to this, and because requests and responses make a round trip, we look at the
RTT
(Round-Trip Time).
Cloudflare describes network latency as
the amount of time it takes for a data packet to go from one place to another
is the rate at which the receiving host actually receives data.
When there are several links on the path from server to client, throughput is limited by the transmission rate of
the slowest link
, which is called the
bottleneck link
.
Path
Server link Rs
Intermediate link R
Client link Rc
Throughput
Single download
1 Gbps
10 Gbps
100 Mbps
100 Mbps
10 downloads sharing the intermediate link
1 Gbps
500 Mbps
100 Mbps
50 Mbps per connection
In the first case, throughput is min(Rs, R, Rc), and the client link is the bottleneck.
In the second case, 10 connections share the 500 Mbps intermediate link, so R/10, or 50 Mbps per connection, becomes the bottleneck.
This calculation is the same problem as finding the
minimum edge capacity
of a path in a graph data structure.
The throughput of a path is the minimum of the edge capacities along it, so improving a link that is not the bottleneck has no effect.
👨💻
When fixing a slow download, find the bottleneck first.
If the user's line is 100 Mbps, increasing the server bandwidth to 10 Gbps will not change the speed the user experiences.
ping measures the RTT and loss rate to a destination.
traceroute shows the RTT to each router along the path, so you can find the segment where delay grows.
In the last lines of the ping output, packet loss shows the loss rate, and round-trip min/avg/max/stddev shows the minimum, average, maximum, and standard deviation of the RTT.
A large standard deviation means queuing delay varies widely.
On Windows, use ping -n 10 and tracert; on Linux, use the same ping -c 10 and traceroute as on macOS.
macOS 12 Monterey and later include a built-in networkQuality command that measures throughput and responsiveness.
networkQuality -v
It shows upload and download throughput together with responsiveness under load.
If responsiveness under load drops sharply, you can suspect that excessive queues are building up in your router or access network.
Measurements vary with the time of day and network environment, so take several measurements and compare them.
processing, queuing, transmission, and propagation delays
add up.
Transmission delay is determined by packet size and link speed, propagation delay by distance, and queuing delay varies greatly with traffic intensity and leads to packet loss when the queue overflows.
End-to-end throughput is determined by the slowest link on the path, the
bottleneck link
.
If overseas users see slow responses, place servers closer to reduce propagation delay; if things slow down at peak times, check queuing and loss; and if downloads are slow, look for the bottleneck link first.
In the next article, we look at
protocol layers and encapsulation
, which divide and manage this complex delivery process.
 Network Delay, Packet Loss, and Throughput